Table of Contents
Introduction
Monitoring Proxmox with Grafana will be a good idea to see the actual resource utilization on our Proxmox cluster. Already we have covered in our previous guide about “How to monitor Linux servers using Prometheus and Grafana“. However, in this guide let’s focus on how to monitor the Proxmox virtualization platform with the help of Proxmox and influxDb.
Proxmox supports Graphite and InfluxDB while comparing the advantage of using InfluxDB and graphite, InfluxDB owns the match. Let’s start to setup influx DB by following below guide.
Right after installing the InfluxDB, start to create the DB user, Database with required privileges.
Creating a Monitoring Database
Creating database for monitoring Proxmox, Replace the user and password value as per standard to your setup.
CREATE USER admin WITH PASSWORD 'Redhat@123' WITH ALL PRIVILEGES
CREATE DATABASE mondb
CREATE USER monuser WITH PASSWORD 'Redhat@123'
GRANT ALL ON mondb TO monuser
exit
Create, Verify and list the created database
sysadmin@monitor:~$ influx
Connected to http://localhost:8086 version 1.8.3
InfluxDB shell version: 1.8.3
> CREATE USER admin WITH PASSWORD 'Redhat@123' WITH ALL PRIVILEGES
> CREATE DATABASE mondb
> CREATE USER monuser WITH PASSWORD 'Redhat@123'
> GRANT ALL ON mondb TO monuser
> SHOW GRANTS FOR monuser
database privilege
-------- ---------
mondb    ALL PRIVILEGES
> SHOW DATABASES
name: databases
name
----
_internal
mondb
>
> exit
sysadmin@monitor:~$
InfluxDB configuration for Proxmox
Few configurations are required for Proxmox. Edit the main configuration for Influxdb to add the require options
$ sudo vim /etc/influxdb/influxdb.confThis port should match to Proxmox metric configuration.
DataCenter –> Metric Server –> Add –> InfluxDB
[[udp]]
   enabled = true
   bind-address = ":8089"
   database = "mondb"
   batch-size = 5000
   batch-timeout = "1s"
Make sure to use the database we created in earlier steps.
Install Grafana for Monitoring Proxmox
First, let’s start to resolve the required dependencies for Grafana installation.
$ sudo apt-get install -y apt-transport-https
$ sudo apt-get install -y software-properties-common wget
Import the apt key for grafana
$ wget -q -O - https://packages.grafana.com/gpg.key | sudo apt-key add -Enable the repository, If you are running from unprivileged account it will prompt to enter the password for privilege escalation.
$ echo "deb https://packages.grafana.com/oss/deb stable main" | sudo tee -a /etc/apt/sources.list.d/grafana.listInstalling Grafana, update the apt cache and by following install the Grafana.
$ sudo apt-get update
$ sudo apt-get install grafana
Unpacking grafana (7.3.6) ...
Setting up fonts-dejavu-core (2.37-1) ...
Setting up fontconfig-config (2.13.1-2ubuntu3) ...
Setting up libfontconfig1:amd64 (2.13.1-2ubuntu3) ...
Setting up grafana (7.3.6) ...
Adding system user `grafana' (UID 112) ...
Adding new user `grafana' (UID 112) with group `grafana' ...
Not creating home directory `/usr/share/grafana'.
### NOT starting on installation, please execute the following statements to configure grafana to start automatically using systemd
sudo /bin/systemctl daemon-reload
sudo /bin/systemctl enable grafana-server
### You can start grafana-server by executing
sudo /bin/systemctl start grafana-server
Processing triggers for systemd (245.4-4ubuntu3) ...
Processing triggers for man-db (2.9.1-1) ...
Processing triggers for libc-bin (2.31-0ubuntu9) ...Configuring Grafana
Post to Grafana installation, we need to make few changes.
$ sudo vim /etc/grafana/grafana.iniFew of interesting configurations for monitoring Proxmox are as follows. If you need to setup a default admin account and password we need to set here before starting the Grafana service.
[paths]
logs = /var/log/grafana
plugins = /var/lib/grafana/plugins

[server]
protocol = http
http_port = 3000

[security]
admin_user = admin
admin_password = admin
Make the Systemd configuration changes by running “daemon-reload” by following enable and start the service persistently.
$ sudo systemctl daemon-reload
$ sudo systemctl enable grafana-server
$ sudo systemctl start grafana-server
$ sudo systemctl status grafana-server
Installing Plugins and Dashboard
Few of cool dashboards are listed below. We will use anyone of below dashboard soon in upcoming steps.
https://grafana.com/grafana/dashboards/10048
https://grafana.com/grafana/dashboards/13307
https://grafana.com/grafana/dashboards/11418
https://grafana.com/grafana/dashboards/11416
If any plugins are missing we could get the alerts in the dashboard. Install the missing plugins by running below command, replace the plugin name with your missing plugin name.
$ sudo grafana-cli plugins install grafana-clock-panel
$ sudo grafana-cli plugins install blackmirror1-singlestat-math-panel
Search for the plugins at https://grafana.com/grafana/plugins
sysadmin@monitor:~$ sudo grafana-cli plugins install grafana-clock-panel
installing grafana-clock-panel @ 1.1.1
from: https://grafana.com/api/plugins/grafana-clock-panel/versions/1.1.1/download
into: /var/lib/grafana/plugins

✔ Installed grafana-clock-panel successfully

Restart grafana after installing plugins . <service grafana-server restart>

sysadmin@monitor:~$


sysadmin@monitor:~$ sudo grafana-cli plugins install blackmirror1-singlestat-math-panel
installing blackmirror1-singlestat-math-panel @ 1.1.7
from: https://grafana.com/api/plugins/blackmirror1-singlestat-math-panel/versions/1.1.7/download
into: /var/lib/grafana/plugins

✔ Installed blackmirror1-singlestat-math-panel successfully

Restart grafana after installing plugins . <service grafana-server restart>

sysadmin@monitor:~$
Now if you check the database, we could see some tables and columns.
sysadmin@monitor:~$ influx -database 'mondb' -username 'mondb' -password 'Redhat@123'
Connected to http://localhost:8086 version 1.8.3
InfluxDB shell version: 1.8.3
> show databases
name: databases
name
----
_internal
mondb
linuxsys_db
>
> use mondb
Using database mondb
>
> show MEASUREMENTS
name: measurements
name
----
ballooninfo
blockstat
cpustat
memory
nics
proxmox-support
system
>
Accessing Grafana
Right after starting the Grafana service, access the URL from anyone of your favorite web browser. The default port of Grafana is 3000.
https://monitor.linuxsysadmins.local:3000The default username and password are admin and admin
If you are accessing dashboard for the first time, it will prompt to change the password.
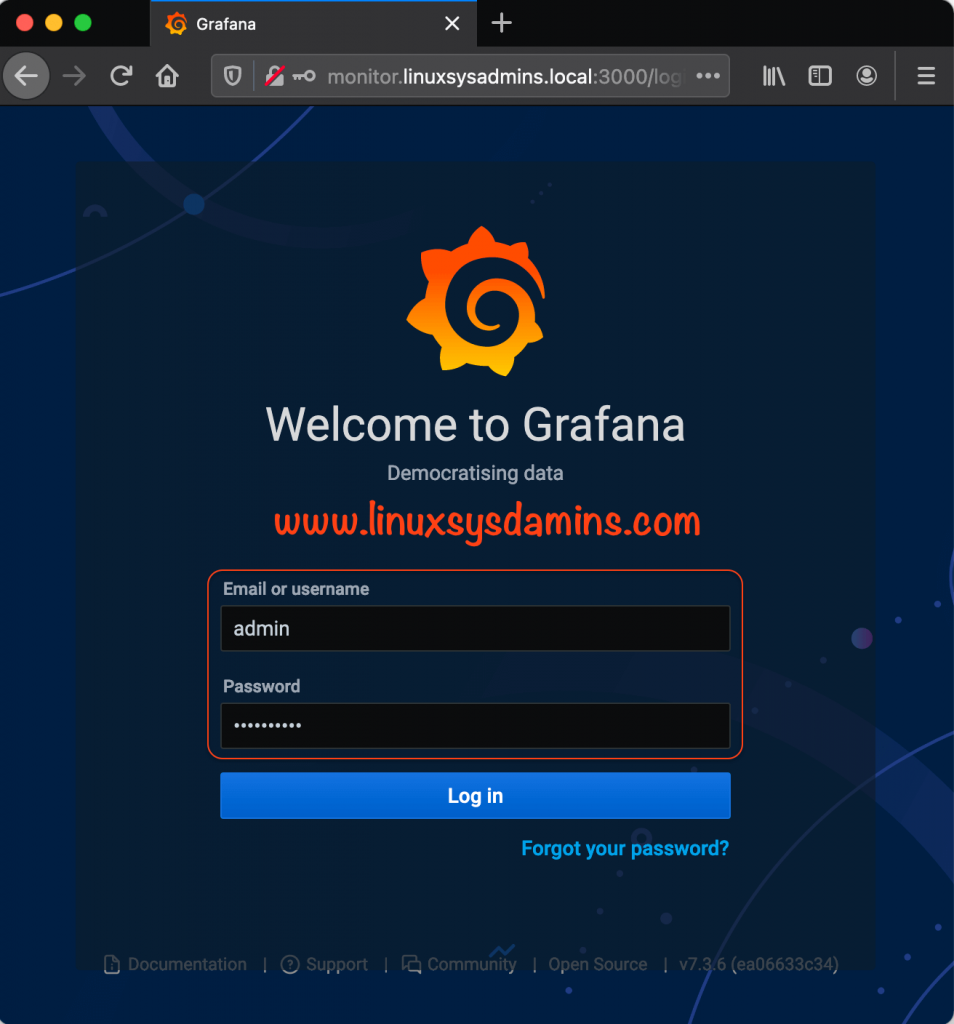
Adding Data Source for Monitoring Proxmox
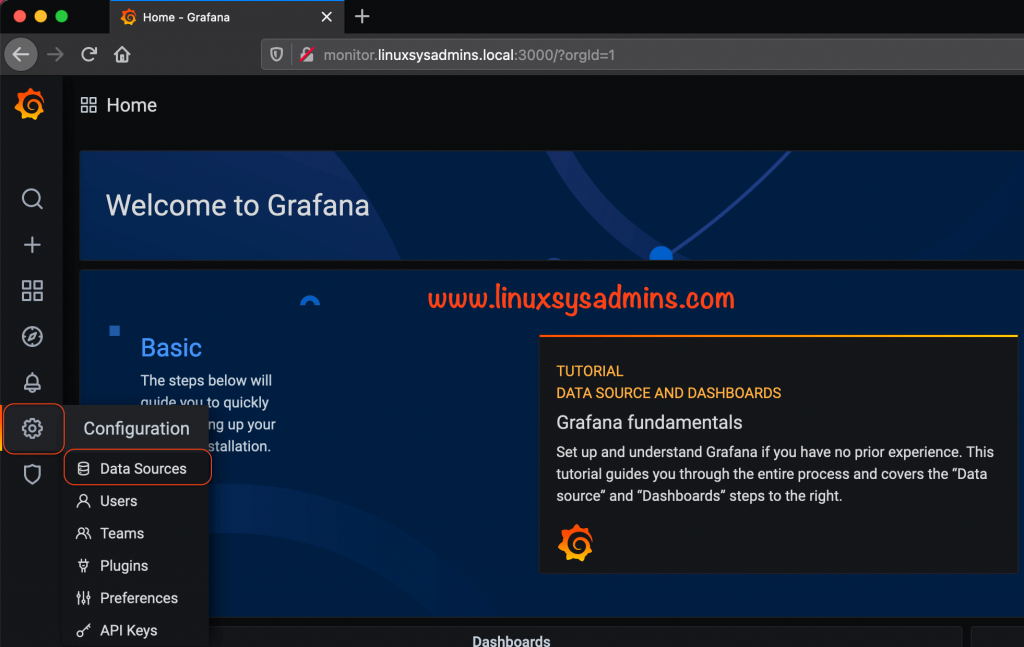
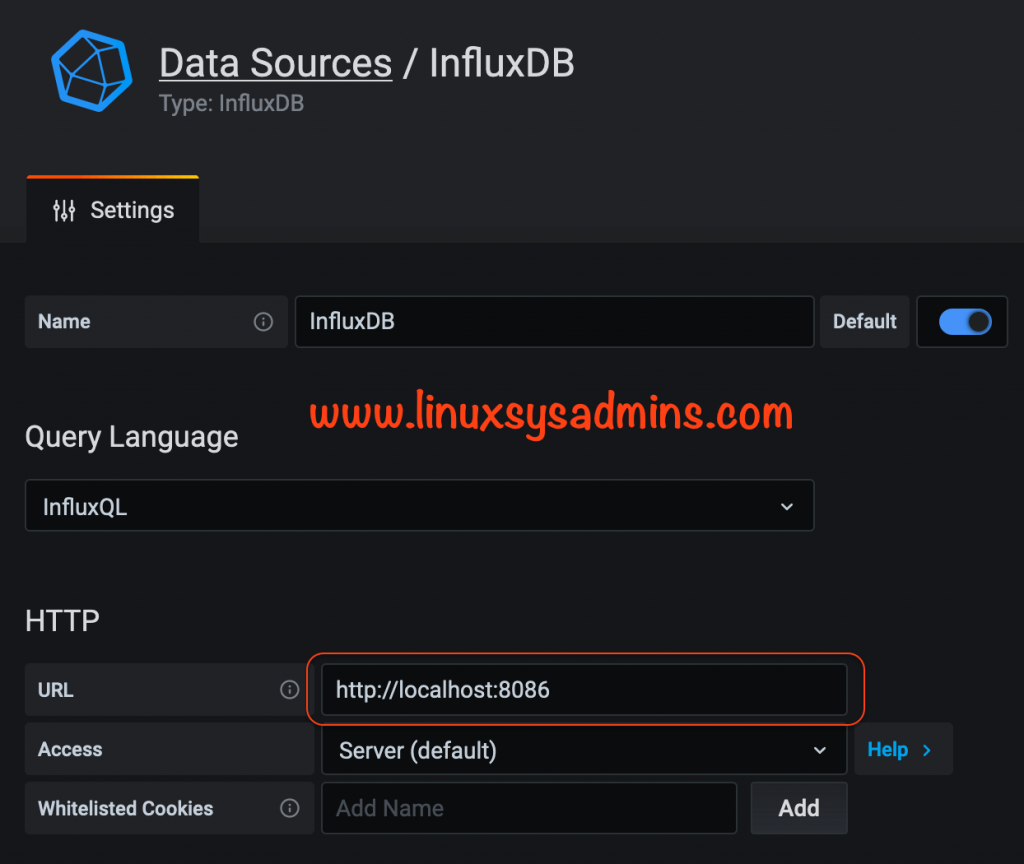
As we have installed and configured to use the InfluxDB for Proxmox, now we need to add the data source with InfluxDB database information.
Navigate to Settings ![]() gear icon –> and select the Data Sources.
gear icon –> and select the Data Sources.
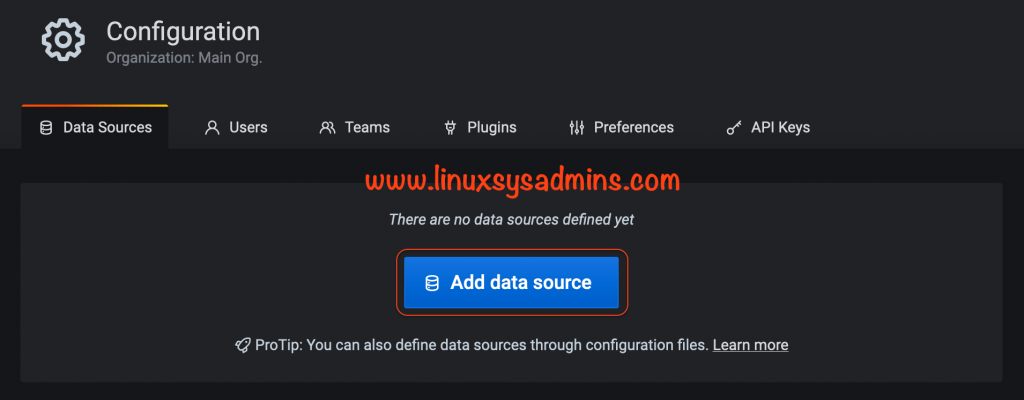
Click the Add data source
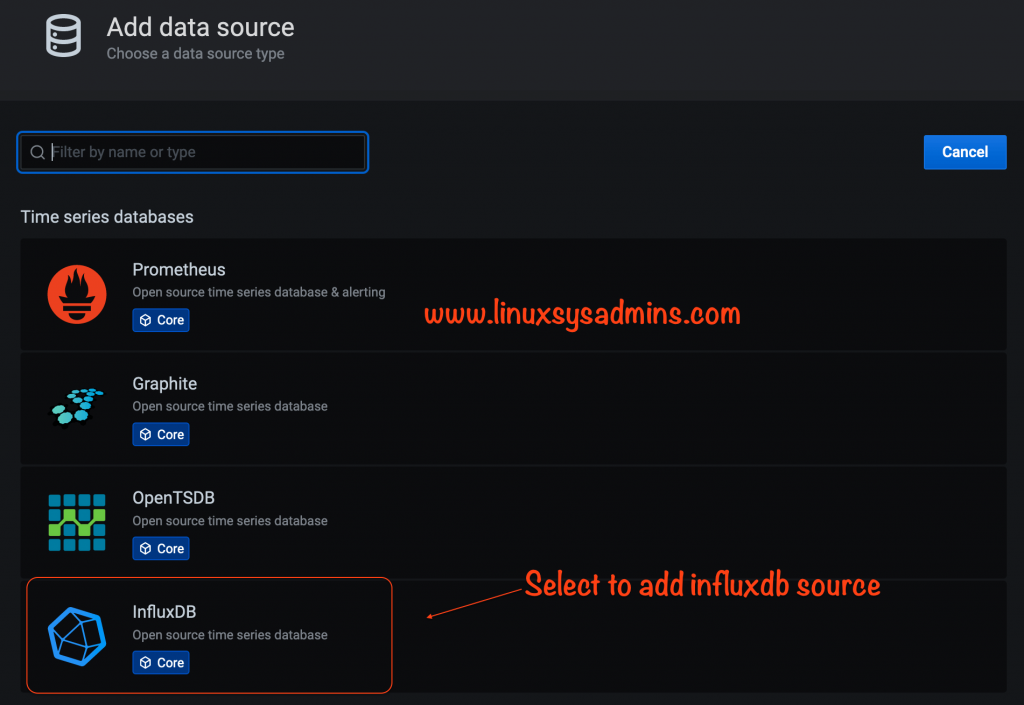
Select InfluxDB by clicking on it.
Feed the HTTP URL where the InfluxDB installed, In our case its on same server where we installed Grafana.
Provide the InfluxDB information and select either GET or POST for HTTP method.
Click the Save & Test to make the connection test and save the configuration.
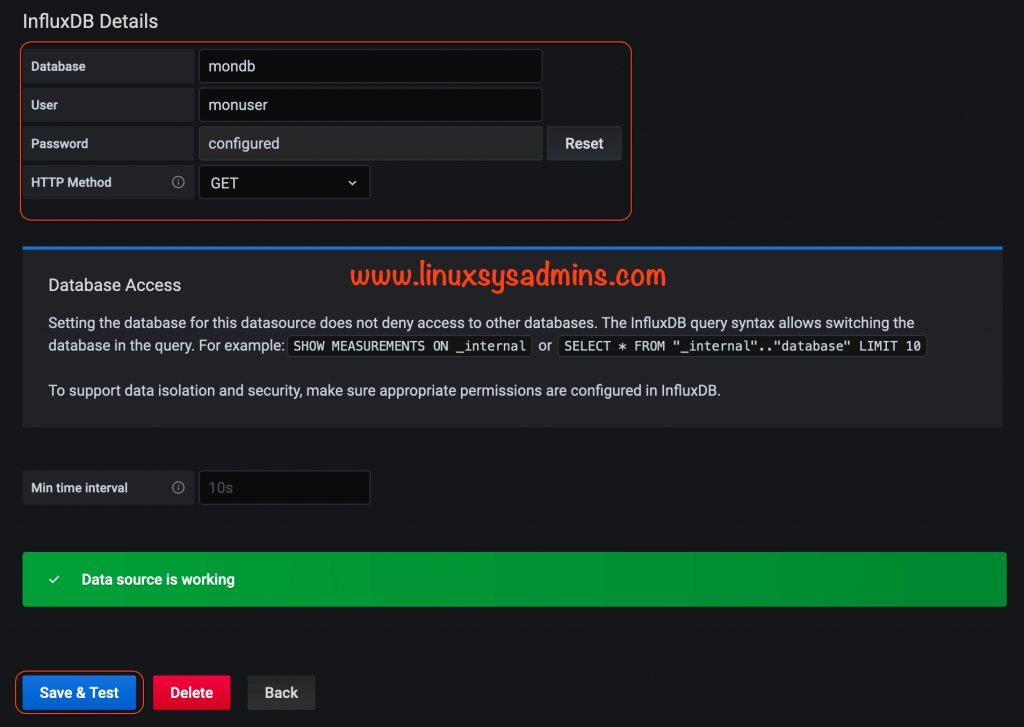
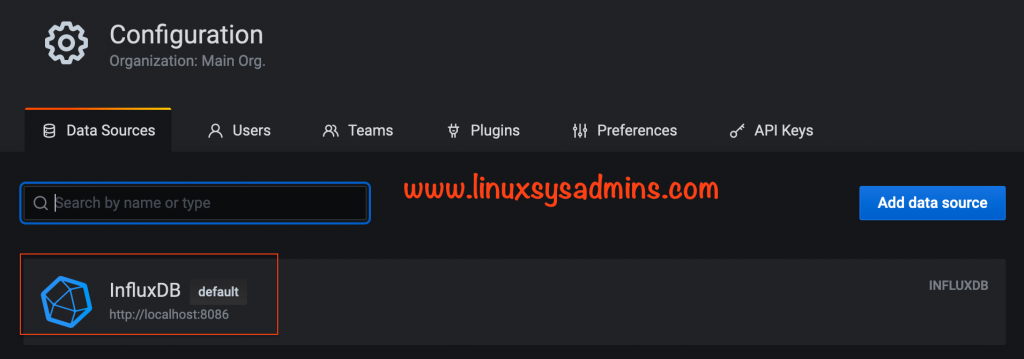
Data Source has been successfully added to start monitoring Proxmox. Now we could see the added Data source in the list.
Importing Predefined Dashboards
There are only very few pre-defined dashboards are available for Proxmox. In our earlier step, We have shared few of dashboards URL. Get the dashboard ID from there
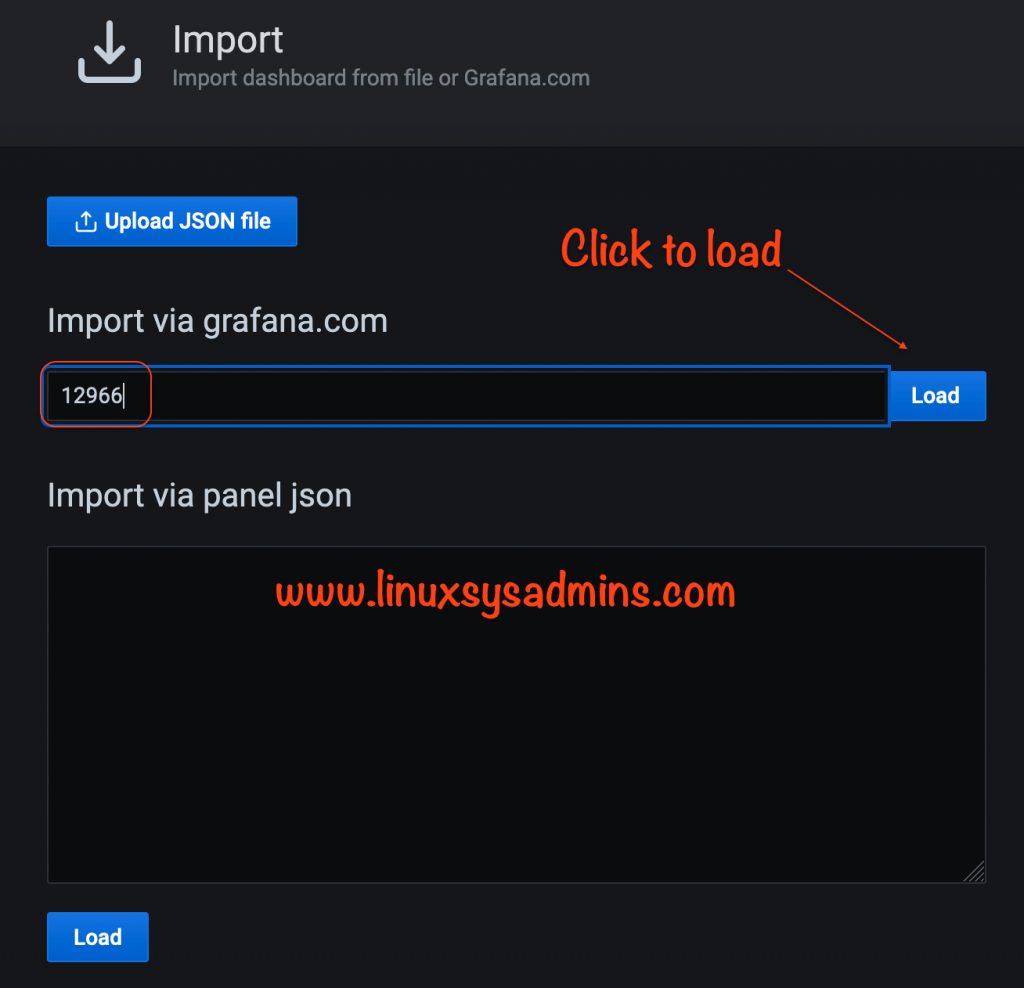
Click the + Symbol from left side pane and select the Import
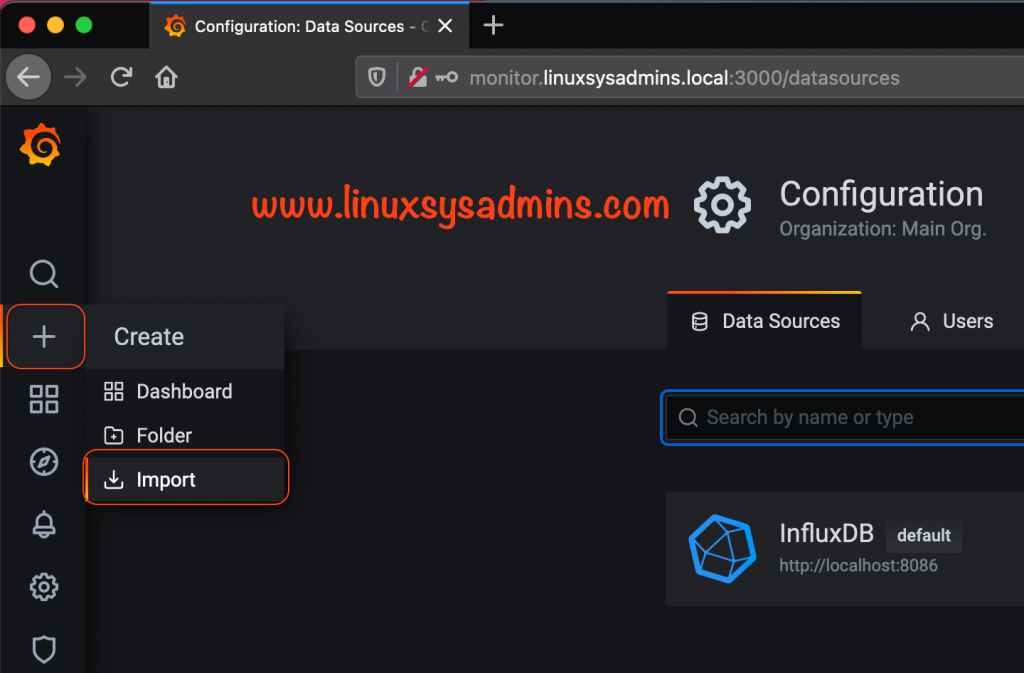
Each predefined dashboard have a ID, copy paste the ID and click load.
Here we are using ID 12966 for demonstration purpose.
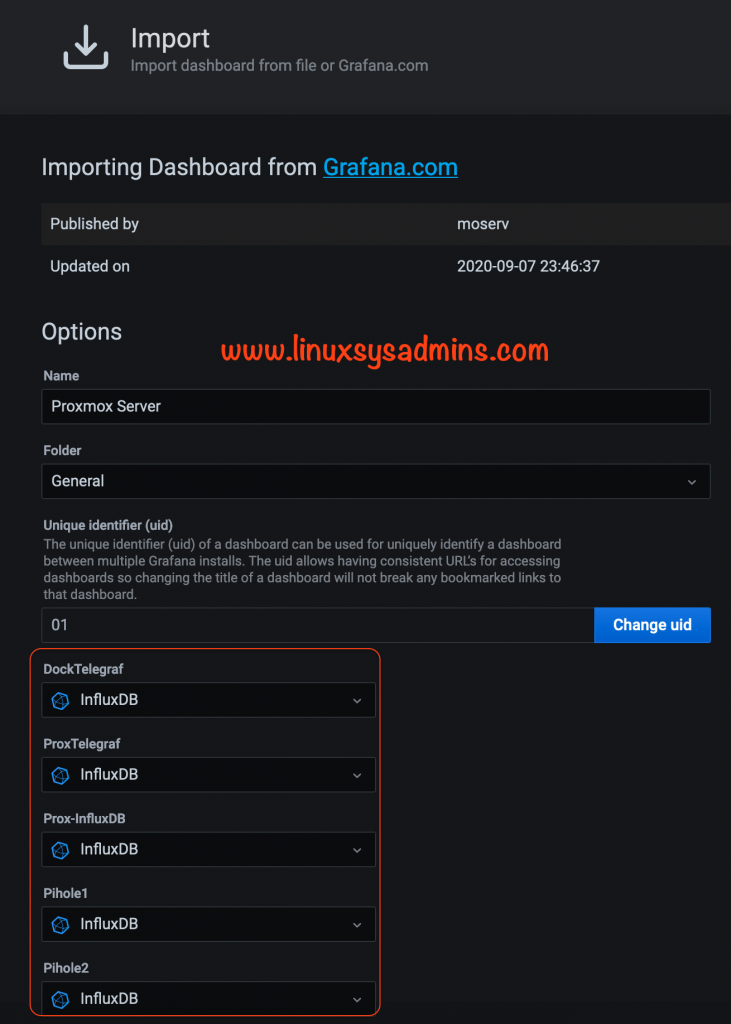
Select all the sources as InfluxDB
Proxmox WebUI Configuration
Switch back to Proxmox webUI and configure the InfluxDB from metrics.
- Navigate to Server View from the drop-down list.
- Select the Datacenter from the list.
- Click on Metric from right side pane above the support option.
- Click Add and select the InfluxDB
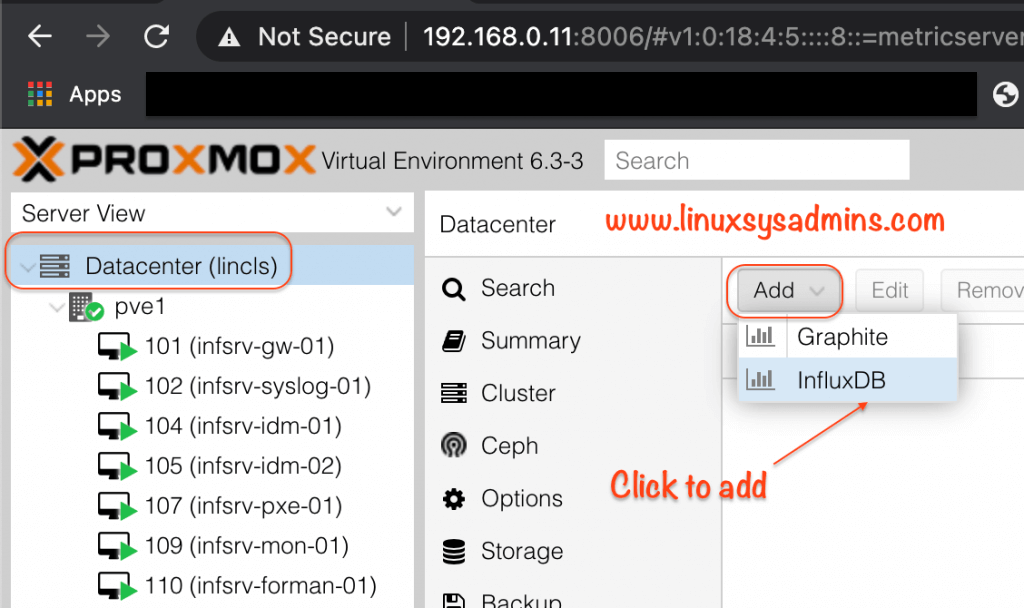
Now we could get the below window.
- Enter a Name
- IP address or hostname of the monitoring server, In my case 192.168.0.50 resolving to monitor.linuxsysadmins.local
- Select the Enabled option.
- Enter the Port number where the data should be sent.
- Click create to create the entry.

To make sure the changes from Proxmox command line.
root@pve1:~# cat /etc/pve/status.cfg
influxdb: monitor
	port 8089
	server 192.168.0.50

root@pve1:~#
Viewing Grafana Dashboards
Back to Grafana GUI and check the Dashboards, now you could get some graphs.
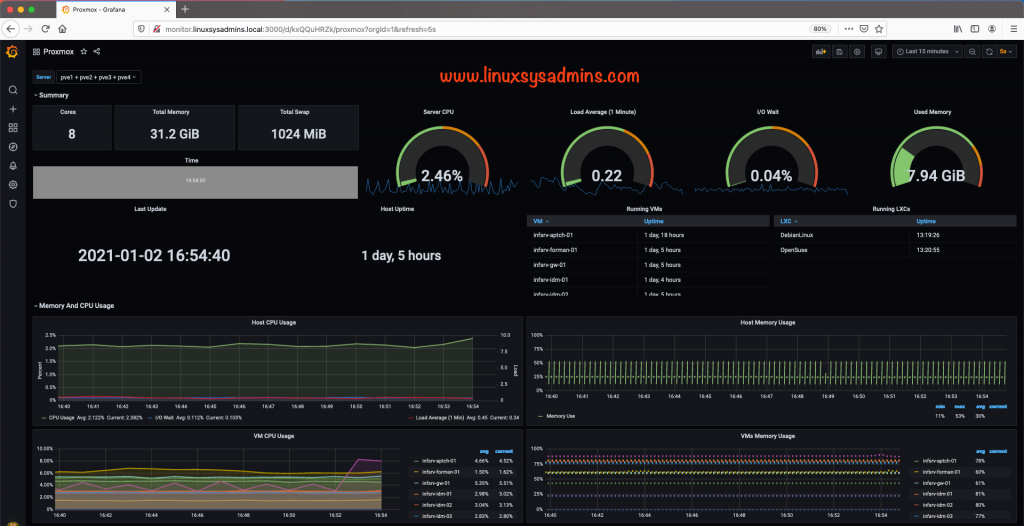
More information.
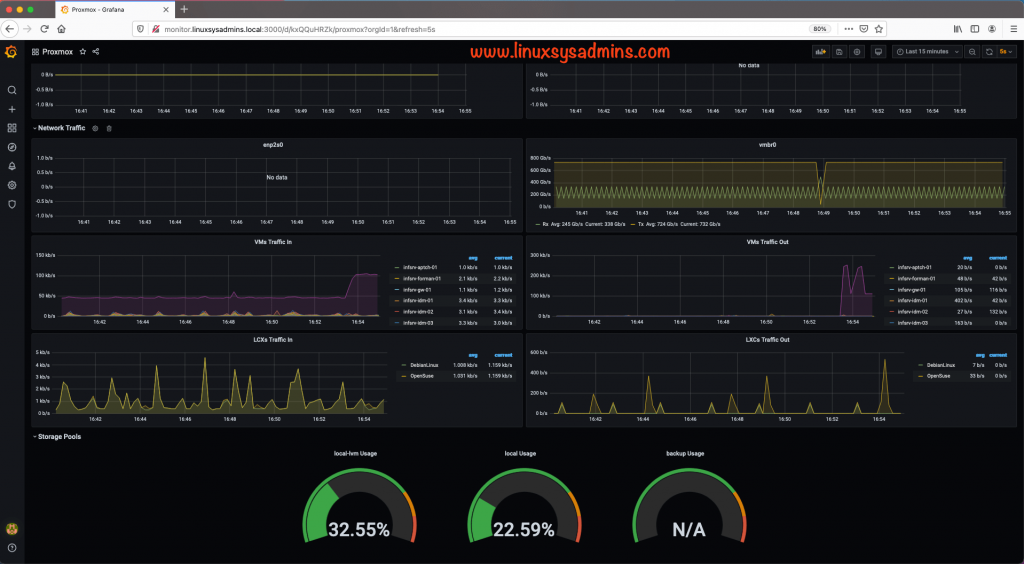
That’s it, we have successfully started to get visualize the Proxmox environment.
Conclusion
To get the metric information of Proxmox Virtualization platform we can use the Grafana with InfluxDB. By installing the InfluxDB and start using Grafana in a few minutes to get a good visualization on your resource utilization in your Proxmox environment. Subscribe to our newsletter and stay close for more updates, your feedbacks are welcome through below comment section.
Tried 12966 per your example, got error “failed to import dashboard.”
And used 8086 in adding InfluxDB as data source.
Hi Kaung,
The default port that runs the InfluxDB HTTP service is 8086.
In Proxmox side the metric port defined with UDP 8089.
Thanks & Regards,
Port 8089 or 8086?
You used 8089 in adding Influxdb in Metric.
In InfluxDB you used 8089 bind address.
Port 8089 or 8086?
You used 8089 in adding Influxdb in Metric.
In InfluxDB you used 8089 bind address.
Did you try to use https://docs.victoriametrics.com ?
Check this link https://docs.victoriametrics.com/Single-server-VictoriaMetrics.html#prominent-features .
Also see this dashboard https://grafana.com/grafana/dashboards/13307 that have already integration with grafana and VictoriaMetrics.
I migrate to VictoriaMetrics from Prometheus and it feels cool.
Following the guide that he takes a lot for granted, but with a bit of experience he does everything anyway. Unfortunately, however, a lot of work to get a poor result because maybe only me but most of the most interesting metrics give a value like “N / A”.
I hope that we can update the guide so that it will also help those who have recently installed proxmox Ve. I personally went from ESXi to Proxmox recently.
Having the same issue as matteo. I have influxdb and grafana in a single container but same no output on “show measurements”. Do wonder what i am doing wrong.
Is it just me or are your data units all wrong? Some of them also report N/A. Poor documentation on Proxmox’s part…
@Anonymous,
Hope you can see my screenshots for reference, yes data missing some network traffic, the dashboard plugins could be outdated.
Thanks & Regards,
Babin Lonston
Hi,
There is no GUI or web application built into InfluxDB 1.7 itself. The http section in the config provides an HTTP API which can be used to interact with the database using the client libraries, InfluxDB CLI, or Chronograf. Chronograf is the main GUI for the TICK Stack, and can be us…
This tutorial is somewhat outdated or refers to an older version of influxdb
Regards
Hello, i tried to follow the guide but it doesn’t work as it should.
I have proxmox and created two virtual machines, one with influxdb and one with grafana.
I have followed all the steps, but when I try to open the DB and to give the command “show measurements” the output is empty.
Can you help me?
In the guide, I’m using 1 Virtual machine for Grafana and InfluxDB.
Whether the port matches on both the place?
# cat /etc/influxdb/influxdb.conf
and
DataCenter –> Metric Server –> Add –> InfluxDB
While adding the data source in Grafana are you using the correct IP address of the influx DB server?
http://IP_address:8086
Don’t use http://localhost:8086
Check this and let me know.
Thanks & Regards,
Babin Lonston